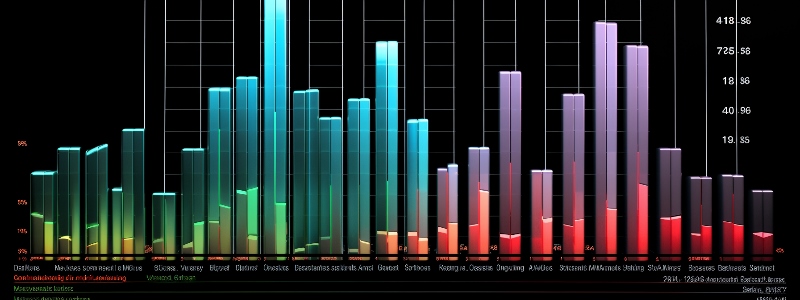
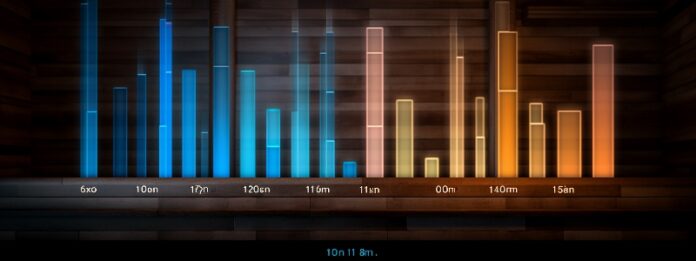
We live in a world that is driven by data. Understanding and making sense of this data for various purposes, from business decisions to academic research, is imperative. Bar charts are one of the most fundamental yet effective ways to represent this data visually. Below, we take a closer look at the definition of bar chart, the different types, and their various applications.
Understanding the Basic Concept of a Bar Chart
A bar chart represents data in rectangular bars with lengths proportional to the values that they represent. A bar chart is a simple and accurate way of dealing with differences between respective data points.
Bar charts can be drawn either vertically or horizontally, depending on the data set. A vertically oriented bar chart is often known as a column chart.
The bars in a bar chart can be split into colored sections, with the number and color of the sections representing certain categories.
Various Components of a Bar Chart
A bar chart consists of various parts, including the x-axis and y-axis, bars, and scales. The x-axis, or horizontal axis, represents the data categories. The y-axis, or vertical axis, represents the scale of measurement.
The bars are the visual representation of the data set. Each bar corresponds to a category on the x-axis. The height or length of the bar corresponds to the amount within each category.
The scale is an important feature of bar charts as it determines the representation of data values on the bars. A properly scaled bar chart will accurately represent the data and not distort the interpretation.
Legends are used to indicate what the different colors in the bars represent. They are an essential feature for a multi-series bar chart.
A Deep Dive Into Types of Bar Charts: Horizontal, Vertical, and Stacked
There are three main types of bar charts: horizontal, vertical, and stacked. The type chosen often depends on the data set and the information one wants to represent.
Vertical bar charts are useful when comparing different categories and are best for data that changes over time.
Horizontal bar charts are effective for comparing the magnitude of items in different categories and are ideal when the category labels are long.
Stacked bar charts are ideal for comparing the total sizes across different categories and the sub-group sizes within the different categories.
Wide Range Applications Where Bar Charts Prove To Be Useful
 Bar charts have wide-ranging applications as they provide a visual presentation of data that supports business decision-making, academic research, and public policy formulation.
In business, bar charts represent sales, profit, loss, and market shares. They provide clear snapshots of performance and trends, helping businesses make informed decisions.
Researchers use bar charts to present data findings and analyses in the academic world. They are useful in comparing different sets of data across various categories.
Public policy organizations use bar charts to visualize vast data, such as population trends, unemployment rates, and other demographic information.
Real-Life Business Scenarios: Bar Charts for Effective Data Presentation
Bar charts serve as effective tools for presenting data in a business setting. For instance, a bar chart can be used to depict the sales performance of different products over a given period.
Moreover, a bar chart can illustrate the impact of a sales promotional activity on various products. It can clearly show which products experienced increased sales and by how much.
Bar charts also come in handy in visualizing and comparing the profitability of different business segments. Based on these charts, the management can evaluate which segments are performing well and which are not.
Bar charts are indispensable tools in business scenarios for presenting and understanding data effectively and efficiently.

